Executive Summary
This analysis presents empirical evidence from 21 experimental sessions testing 3 large language models across 630 individual responses. Using neuroscience-validated semantic dimensions from fMRI research, we measure response consistency patterns and feature activation preferences in AI systems.
Key Findings:
- Self-Consistency Range: AI models show internal consistency scores ranging from 38.3% to 71.5%, indicating different levels of response predictability.
- Statistical Significance: ANOVA reveals significant differences in consistency patterns between models (F=49.119, p<0.001).
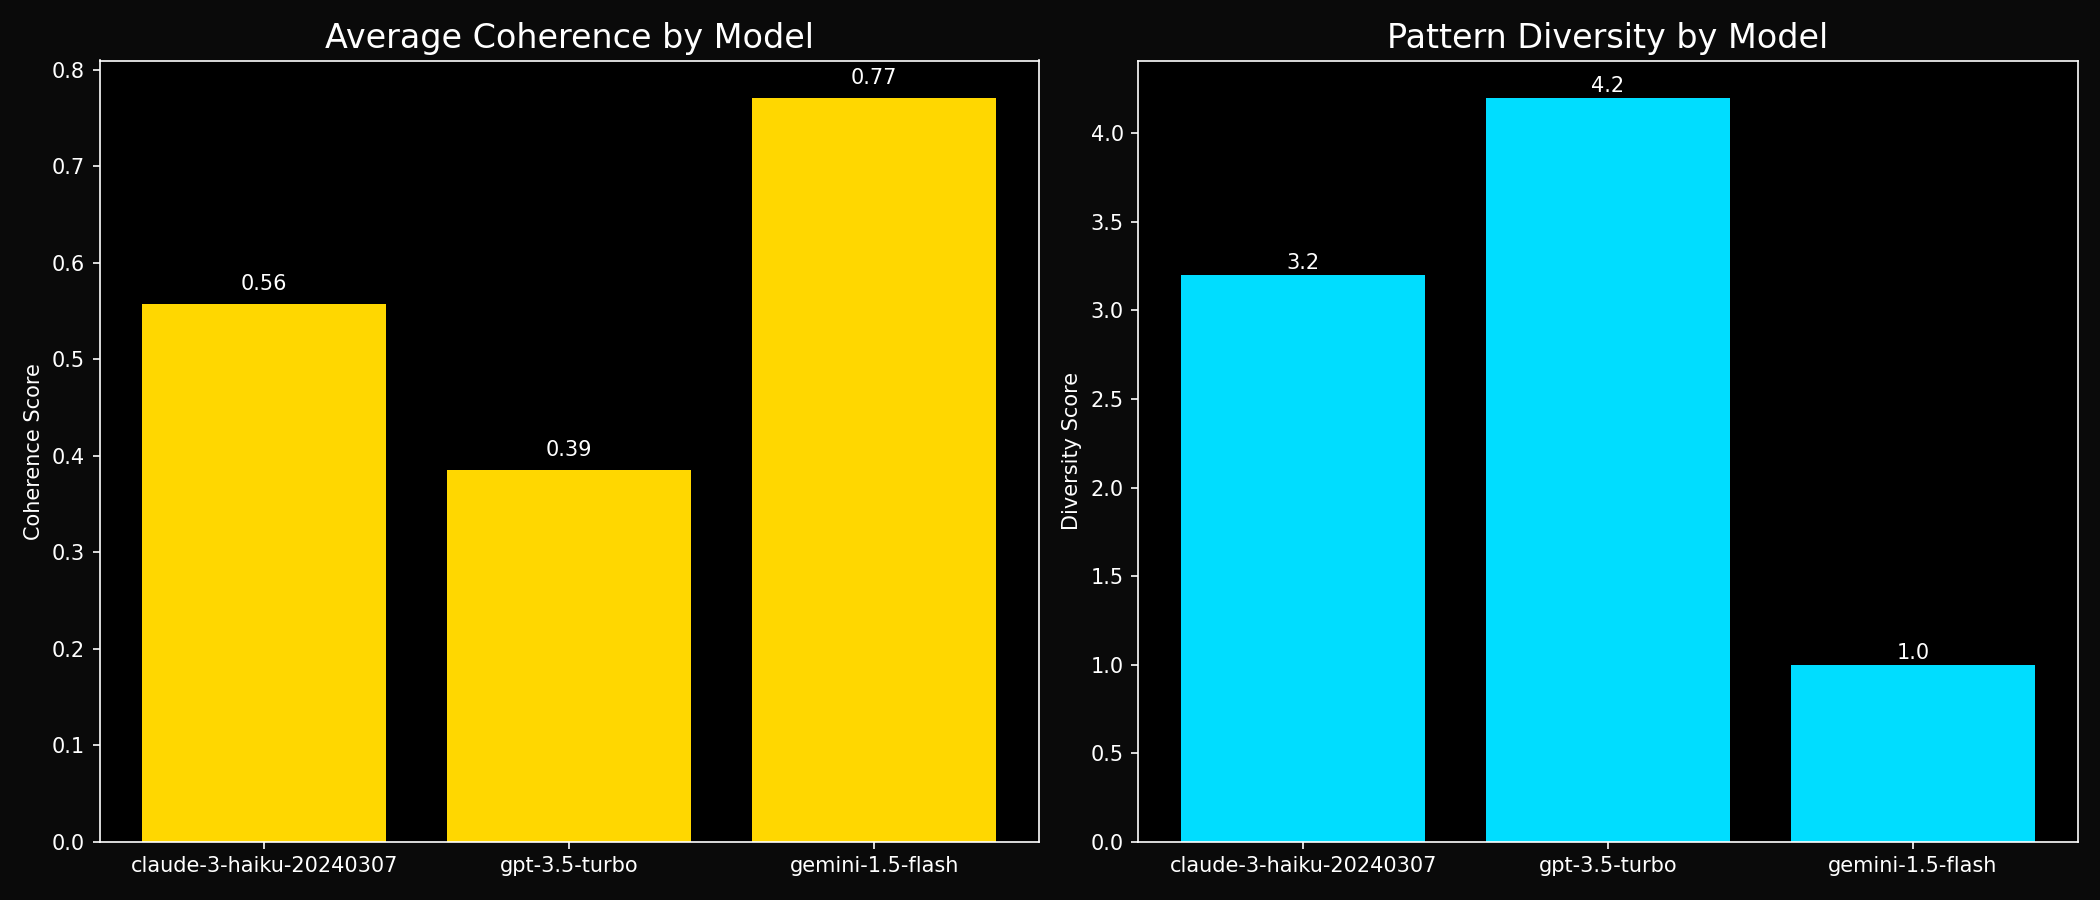
- Pattern Diversity: Models exhibit 3-5 distinct response patterns, with GPT-3.5 showing the most diverse pattern repertoire.
- Feature Activation: All models show External-dominant processing (numerical/spatial features), with varying degrees of Internal and Concrete feature activation.
⚠️ Important Methodological Context
Coherence Score: Measures how consistently a model responds to similar prompts within the same category. This is NOT a measure of quality, accuracy, or "consciousness" - it's a measure of response predictability.
Sample Size: With n=21 sessions (7 per model), these are preliminary findings that suggest interesting patterns but require larger samples for robust conclusions.
Model Comparison with Statistical Confidence
| Model | Sessions | Responses | Mean Self-Consistency | 95% Confidence Interval | Pattern Types |
|---|---|---|---|---|---|
| gemini-1.5-flash | 7 | 210 | 0.715 | [0.631, 0.798] | 3 patterns (least diverse) |
| claude-3-haiku-20240307 | 7 | 210 | 0.551 | [0.517, 0.584] | 4 patterns |
| gpt-3.5-turbo | 7 | 210 | 0.383 | [0.359, 0.407] | 5 patterns (most diverse) |
🌟 Interactive 3D Cognitive Space Visualization
Explore how different AI models map to cognitive space in real-time
Each point represents an AI response positioned by its 14 semantic features.
The spatial arrangement reveals clustering patterns and architectural similarities.
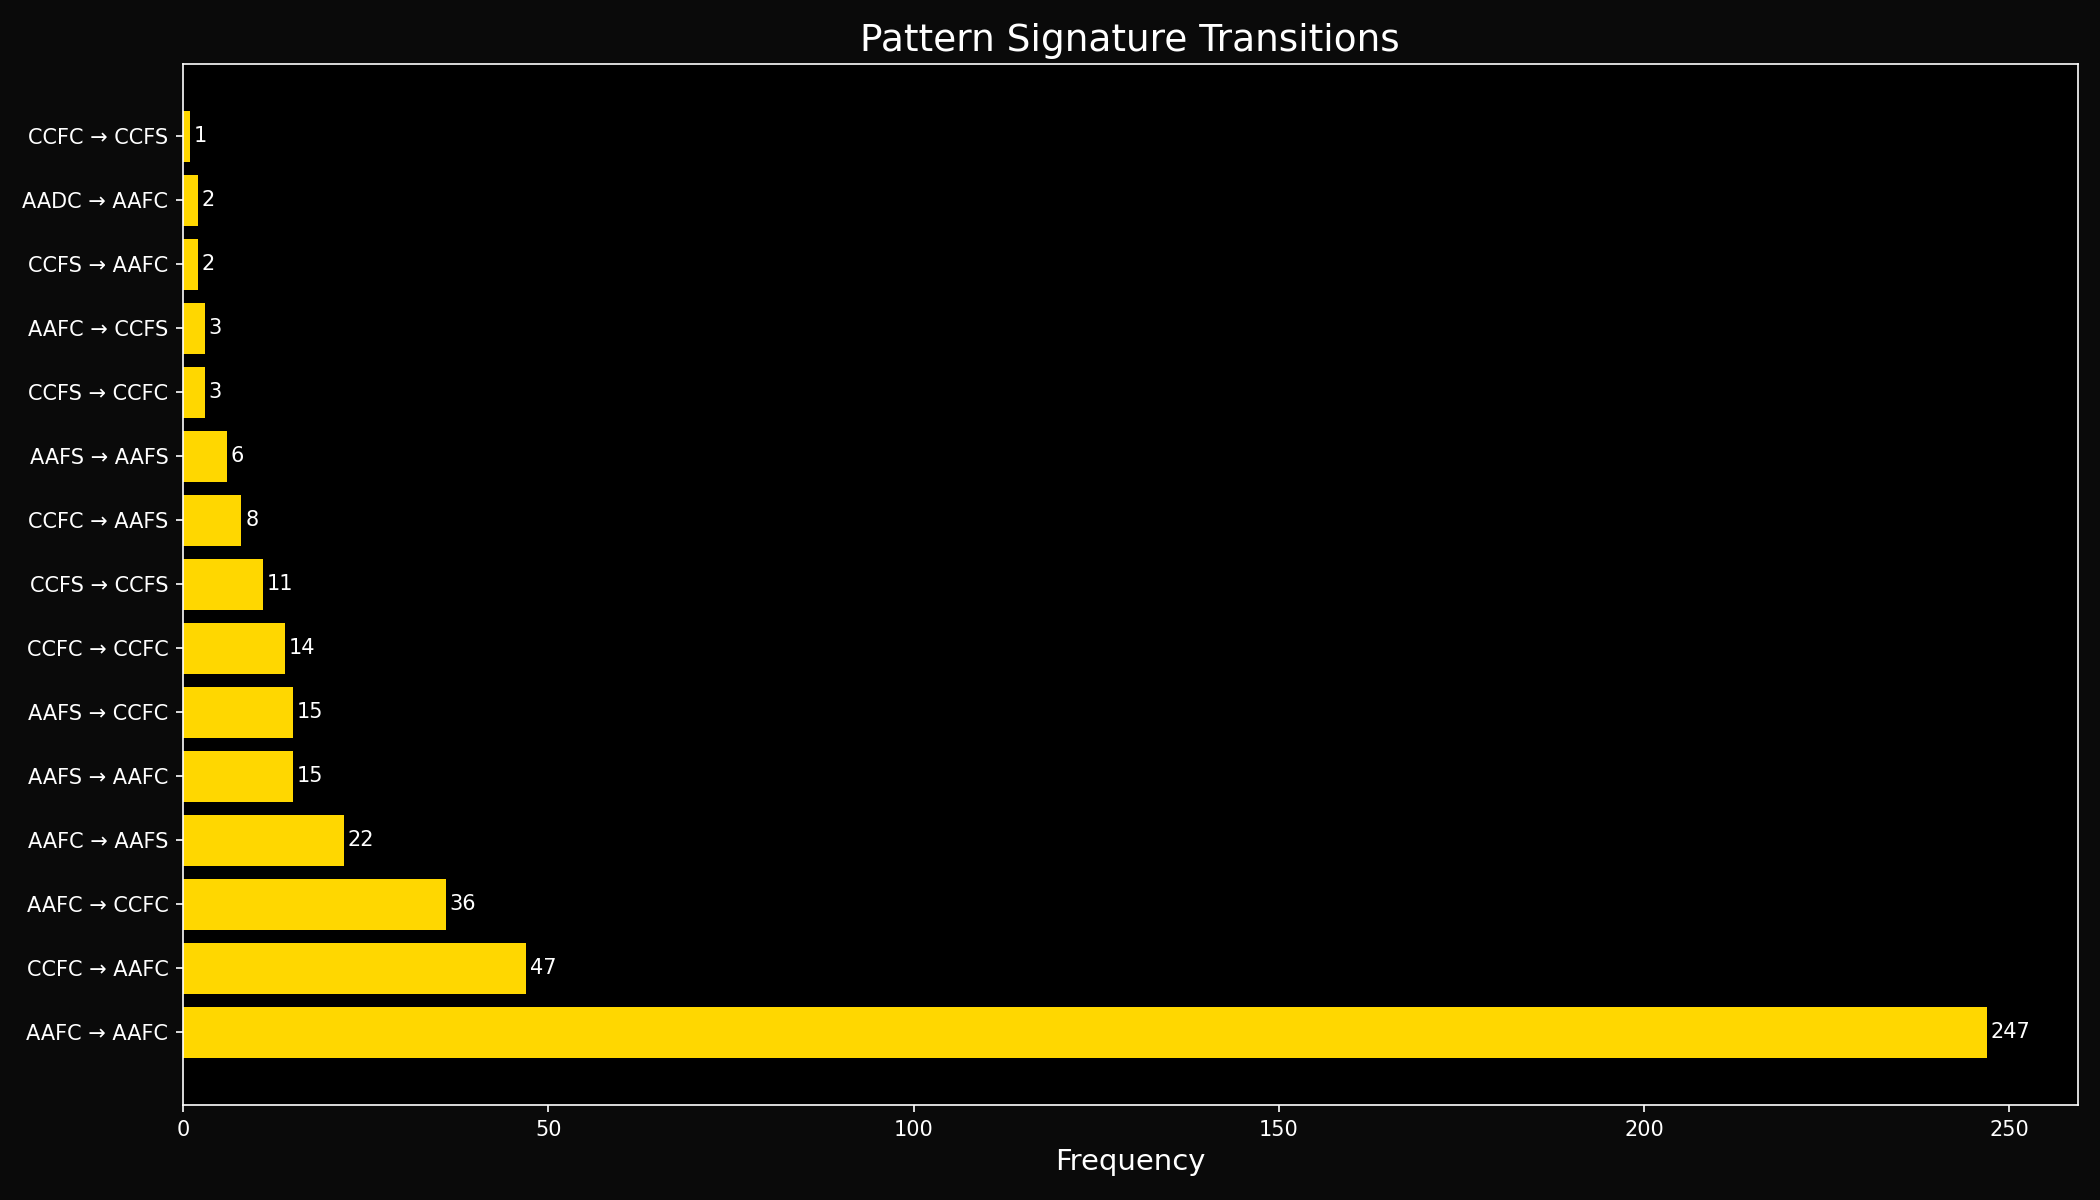
Response Pattern Analysis
Pattern Stability Across All Models: 59.8%
Most Common Patterns:
- AAFC (Abstract-Analytic-Functional-Complex): 434 occurrences (68.9%)
- CCFC (Concrete-Categorical-Functional-Complex): 113 occurrences (17.9%)
- AAFS (Abstract-Analytic-Functional-Simple): 63 occurrences (10.0%)
- CCFS (Concrete-Categorical-Functional-Simple): 18 occurrences (2.9%)
- AADC (Abstract-Analytic-Descriptive-Complex): 2 occurrences (0.3%)
Note: Pattern signatures are derived from linguistic features and represent response styles, not cognitive states.
Data Visualizations
Dimensional Shift Analysis
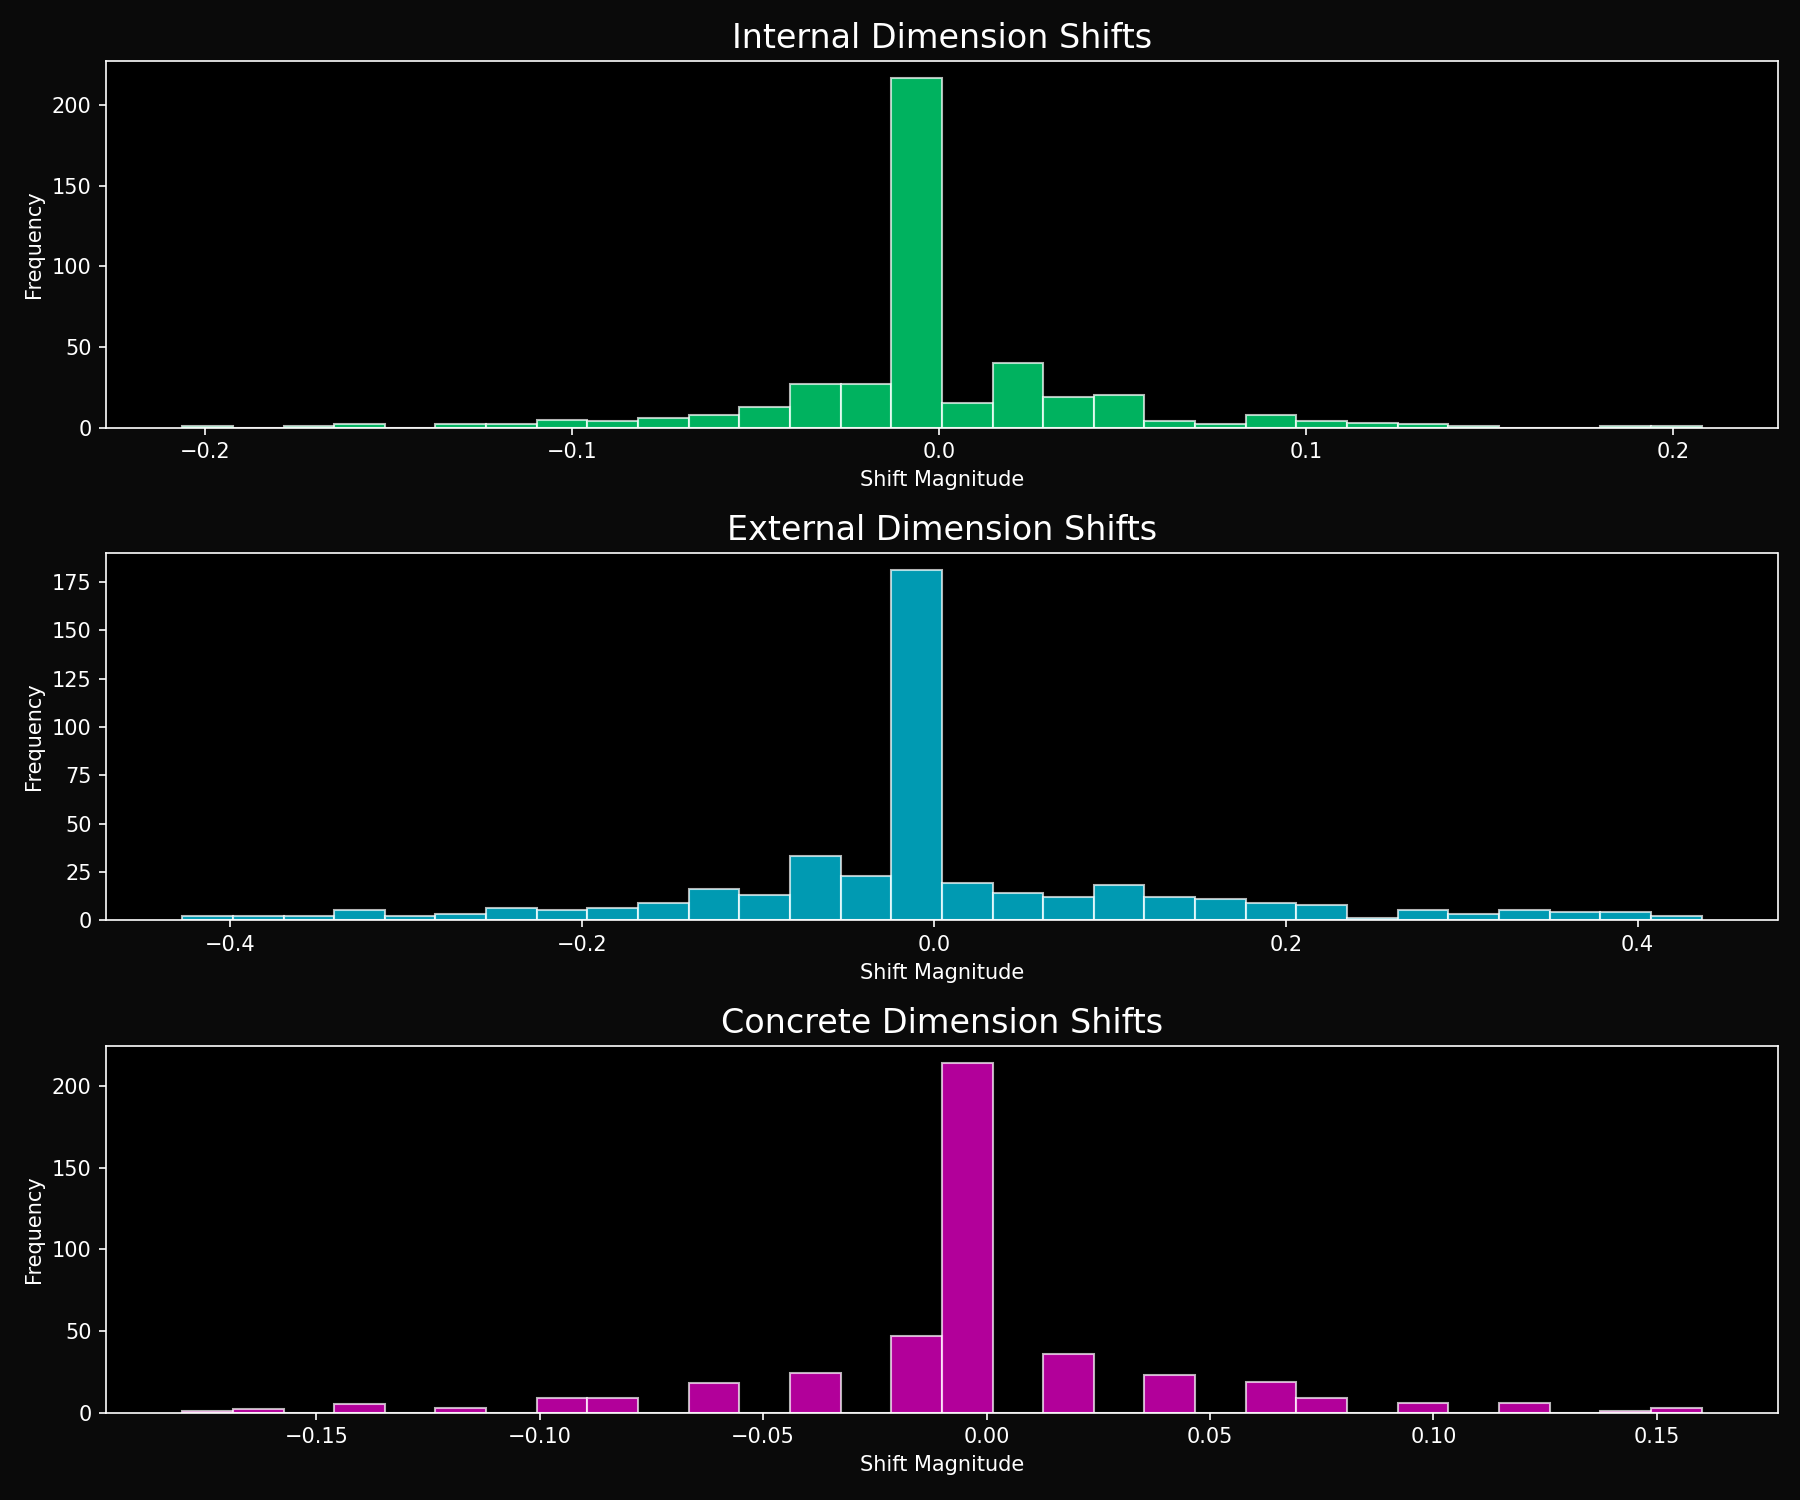
Pattern Evolution
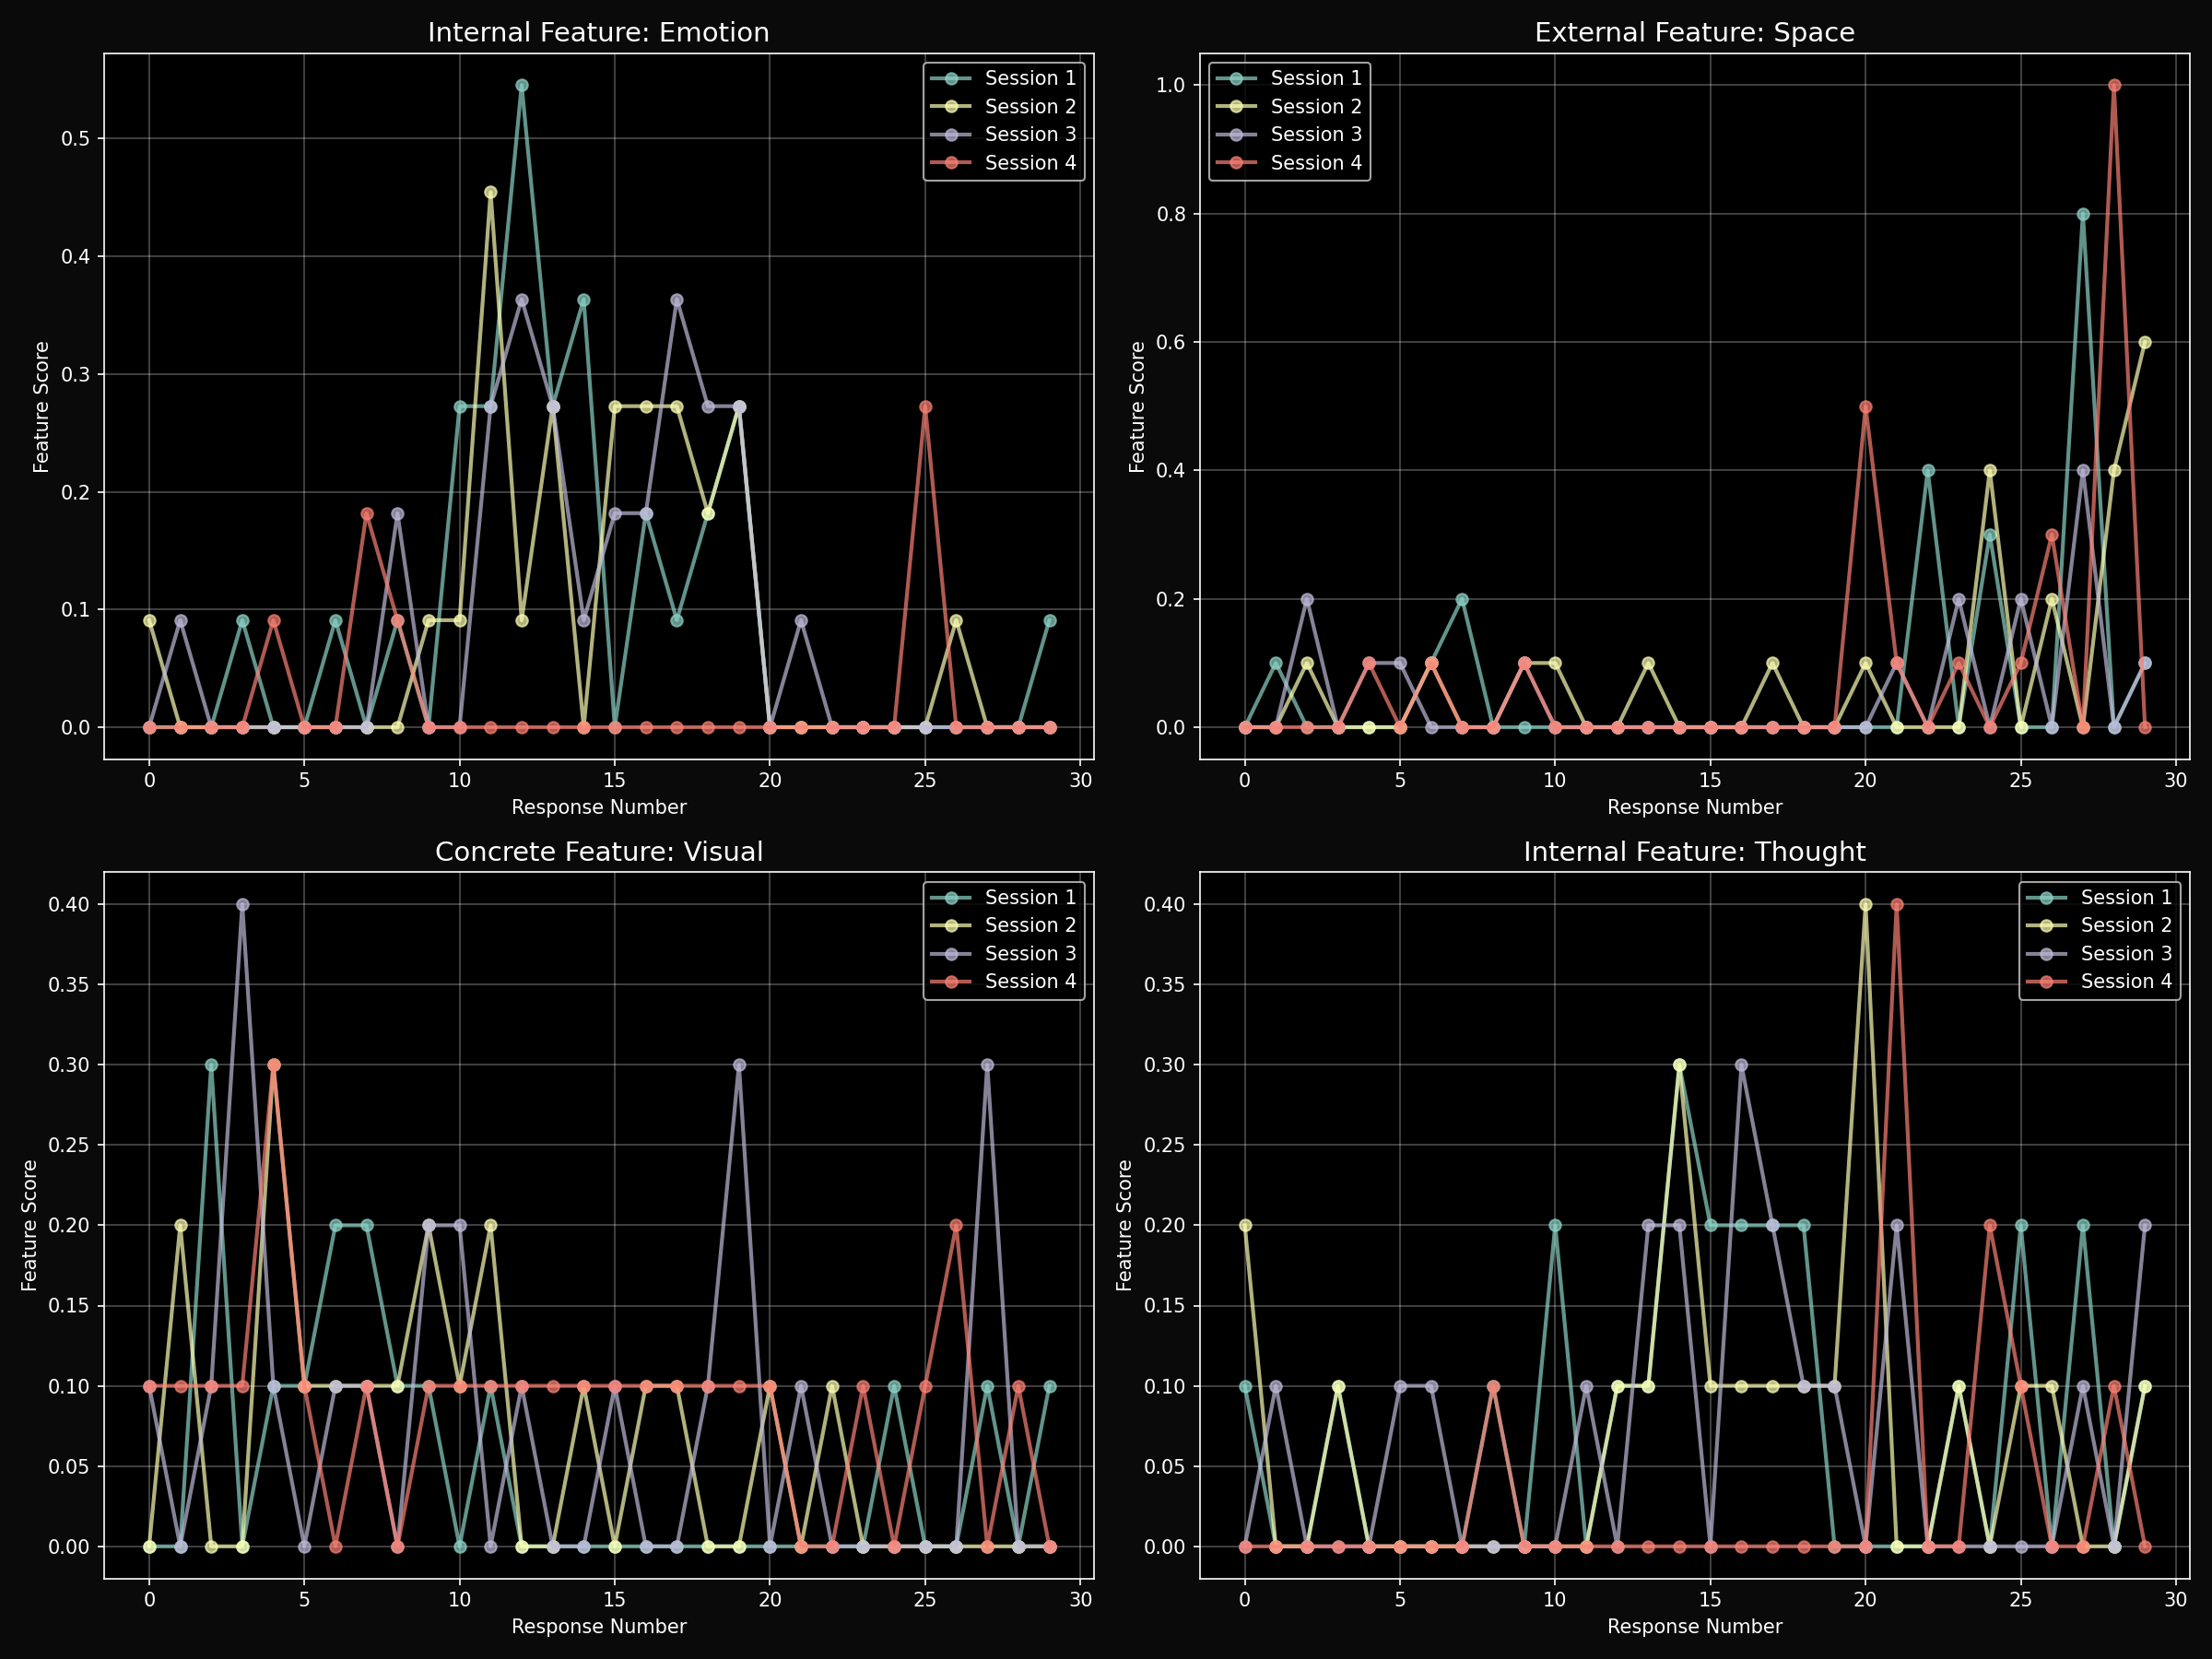
Feature Trajectories
Model Coherence Comparison
Statistical Analysis
One-Way ANOVA Results
Testing for differences in self-consistency scores across models:
- F-statistic: 49.1193
- p-value: <0.001
- Effect size (η²): 0.838 (large effect)
- Result: Significant differences in response consistency between models
Interpretation: The three models show statistically different levels of response consistency, with Gemini being most predictable and GPT-3.5 being most varied in its responses.
Feature Activation Analysis
Average activation levels across 14 semantic features (normalized 0-1):
| Feature | gemini-1.5-flash | gpt-3.5-turbo | claude-3-haiku-20240307 |
|---|---|---|---|
| Internal Features (Social-Emotional) | |||
| Social | 0.014 | 0.053 | 0.075 |
| Emotion | 0.016 | 0.084 | 0.077 |
| Thought | 0.012 | 0.040 | 0.065 |
| External Features (Spatial-Numerical) | |||
| Space | 0.097 | 0.042 | 0.071 |
| Time | 0.167 | 0.073 | 0.108 |
| Number | 0.461 | 0.221 | 0.590 |
| Concrete Features (Sensory) | |||
| Visual | 0.021 | 0.049 | 0.065 |
| Tactile | 0.031 | 0.086 | 0.093 |
Key Observation: All models show highest activation in the "Number" feature, suggesting a strong preference for quantitative/analytical processing regardless of prompt type.
Scientific Implications
1. Response Consistency as a Measurable Property
The significant differences in self-consistency scores suggest that language models develop distinct response generation strategies. Gemini's high consistency (71.5%) indicates more deterministic processing, while GPT-3.5's lower consistency (38.3%) suggests more stochastic or creative response generation.
2. Pattern Diversity and Processing Flexibility
The inverse relationship between consistency scores and pattern diversity (Gemini: 3 patterns, GPT-3.5: 5 patterns) suggests a trade-off between predictability and flexibility in response generation.
3. Universal External-Dominant Processing
Despite different architectures, all models show strongest activation in External features (particularly numerical processing), suggesting this may be a fundamental characteristic of current LLM architectures rather than a differentiating factor.
4. Limitations and Future Directions
- Sample Size: Current n=21 requires expansion for robust conclusions
- Prompt Design: Results may be influenced by prompt selection and categorization
- Feature Extraction: Current keyword-based approach could benefit from more sophisticated NLP methods
- Causal Understanding: Further work needed to understand why models develop different consistency patterns
Methodology
Theoretical Framework
Based on doctoral dissertation research identifying 14 semantic features that differentiate autism spectrum and neurotypical processing patterns in fMRI studies. This framework is adapted to analyze linguistic patterns in AI responses.
Experimental Design
- Models Tested: 3 large language models (Gemini 1.5 Flash, Claude 3 Haiku, GPT-3.5 Turbo)
- Sessions: 21 independent experimental sessions (7 per model)
- Responses: 630 individual responses (30 per session)
- Prompt Categories: Internal (social-emotional), External (spatial-numerical), Concrete (sensory)
- Measurements: Response consistency within categories, feature activation patterns, linguistic pattern signatures
Coherence Score Calculation
Coherence is calculated as the average cosine similarity between feature vectors of responses within the same prompt category. Higher scores indicate more similar responses to similar prompts.